We won’t dig too deep into specifics, but if you are working with somebody who is flipping properties, you will work differently than with somebody who is buying rentals or who is wholesaling.
Target:
Towns Neighborhoods, Properties, Flip Rent
I will show you all three in session two. For right now, let’s talk about how to identify the right towns to invest in.
You may be in a heavily populated area like LA County or New York City. Or maybe you’re in the Hamptons, Pittsburgh, Philadelphia, Atlanta, Miami, Ft. Lauderdale, Houston, or Chicago. There are many towns and townships in those surrounding areas. You need to identify which of are the right ones to go after.
Then we’ll learn how to identify the right specific neighborhoods objectively with unambiguous online tools for analysis. Then you can follow up more subjectively with a drive-through, walk rounds and property tours.
We will touch on the different strategies: flipping, renting and wholesaling. (You can actually wholesale flips and rentals as well as wholesale single-family homes.) I discovered this several years ago while servicing multiple asset managers and large banks around the country. I was a banker for years and knew how to sell a lot of REOs.
I had already sold over 1,100 REO properties before I even met these guys in 2007.
But afterward, I was breaking records and all kinds of neat stuff. Let me show you how it works.
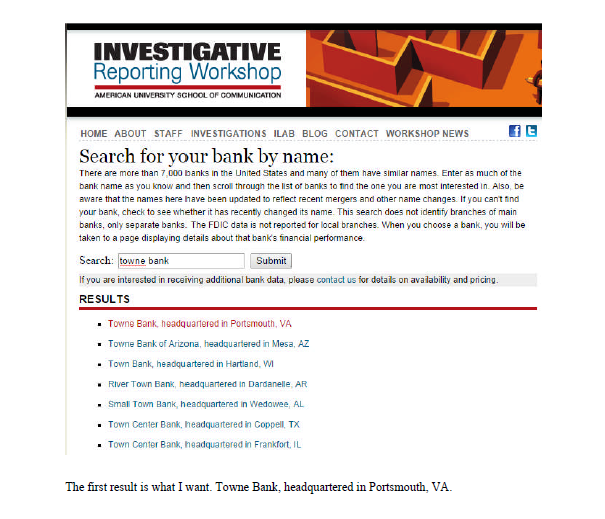
Say you want to find a local bank. I’ll explain why this is important in a second. Let’s use one in
Hampton Roads, Virginia: Towne Bank.
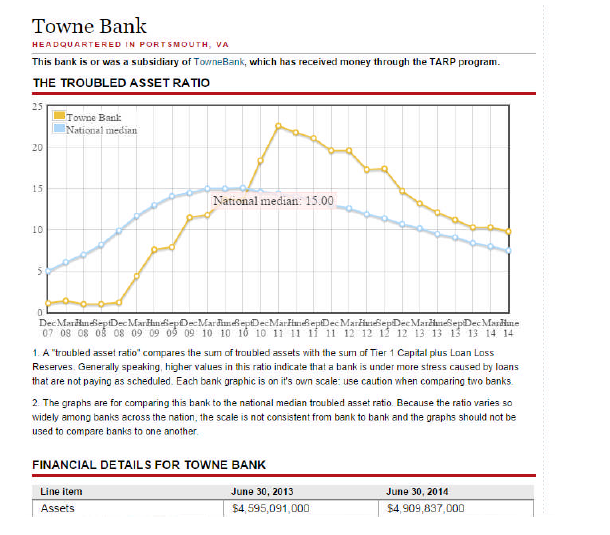
We see a troubled asset ratio. Towne Bank’s troubled assets are shown in gold and the national
median is in blue. You can see around late-2010 to early 2011 Towne Bank was in a little bit of
trouble. They had more troubled assets on their books compared to the national average.
Why is this important? Because these are banks you can approach to get listings to sell to your
investors!
You get some actual numbers here. This is the basic health of the financial institution.
I suggest using smaller, sub-regional, independent banks. If you try to go after the Wells-Fargos
and Bank of Americas (and the big underwriters Fannie Mae and Freddie Mac) there are literally
thousands of agents clamoring and clawing for those guys’ attention.
If you work in an area with local, sub-regional banks (particularly ones you do business with)
check them out on this website. If you see the gold line going way up relative to the blue line, go visit them the very next day in person.
Wear your best suit and take a briefcase. Show them what you are doing, what you are
able to do and tell them, “Just give me one asset. Let me sell it. Let me show you what I can do.”
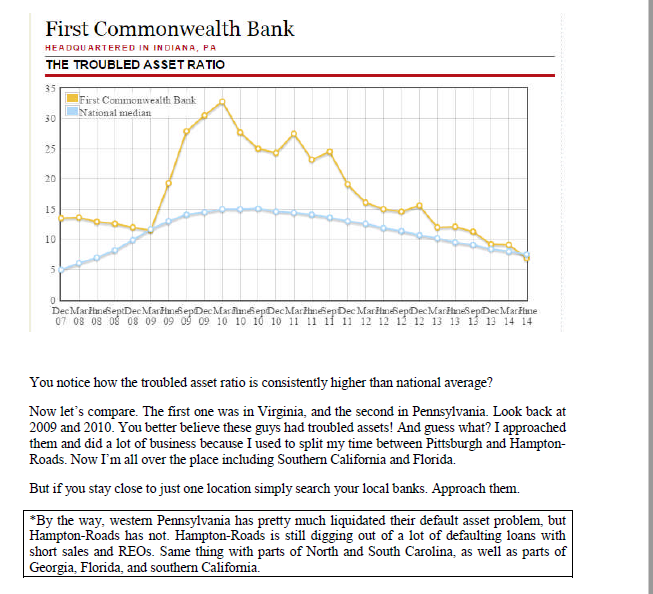
Let’s try another bank. First Commonwealth.
Find the Right Town
Next is spcregion.org. This is a southwestern Pennsylvania Commission.
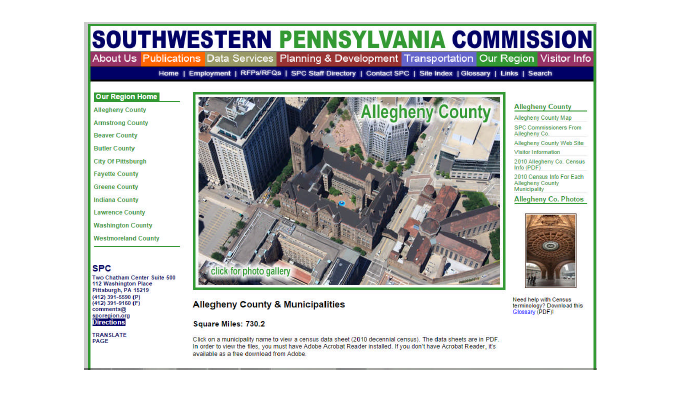
Eleven pages of population data. This is extremely important to your investors so it should
extremely important to you. If you know this stuff, just imagine how much credibility and
respect you’ll get from your Investor clients when you know what they know. 2010 Census data is available nationwide online for most regions of the country. I prefer to use this format because it is already complied, structured, and organized for me. If you go directly to census.org you may have to do a lot more work to get the same level of detail.
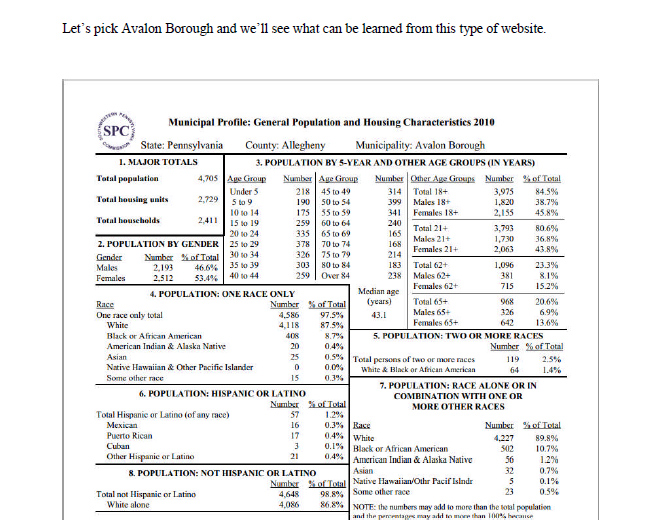
We can see from this report how many people are in each age segment. In Avalon, a high
percentage is aged 65-69, as well as 70-74. There’s a dip in the 60-64 range, but pretty good
numbers around 25-29 and 20-24, and 30-34. If you’re supporting Investors buying rentals, this is good information. A lot of people in those prime rental age groups live in Avalon.
You will also find data on:
Population of households in group quarters
Population of group quarters by type
Total number of households
People over age 18
People under age 18
People over 65
Vacant housing units
You think that would be important to your Investors? You betcha!
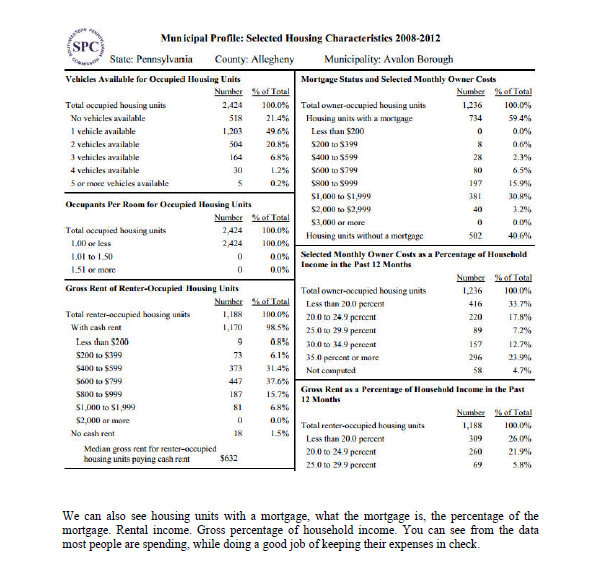
You can also find data on occupied housing units, owner-occupied housing units, and renteroccupied
housing units.
When you see a two-thirds/one-third ratio (in other words two-thirds of the inventory is used for
rentals and one-third is owner-occupied), that’s a great ratio for Investors who want to buy rental
properties.
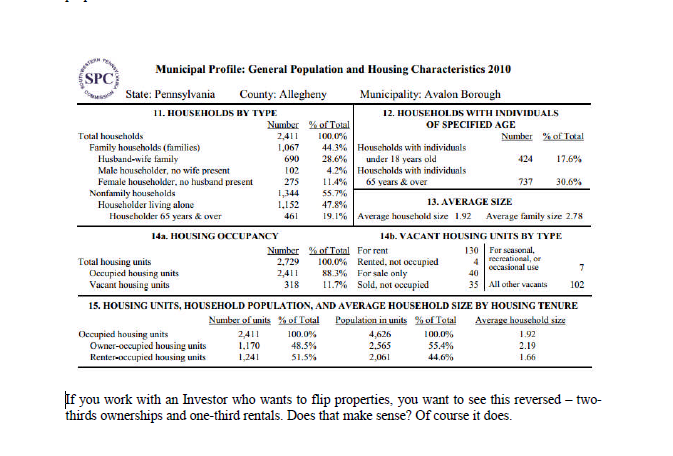
If you work with an Investor who wants to flip properties, you want to see this reversed – two-thirds ownerships and one-third rentals. Does that make sense? Of course, it does.
You need to know and understand these principles. The data is individual to each subject area,
relative to the county, relative to the region, relative to the state, relative to the United States of
America. You think that information might be important to your investors? You better believe it! So
earmark this website and find the one that’s appropriate for your communities, wherever you are
in the country.
* * *
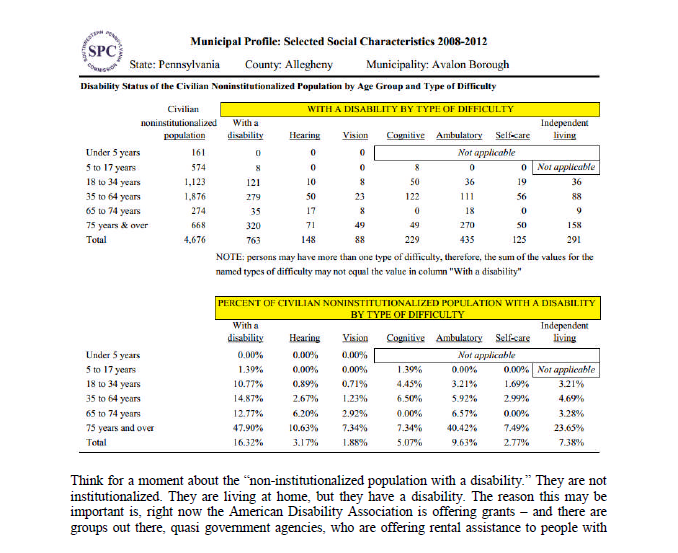
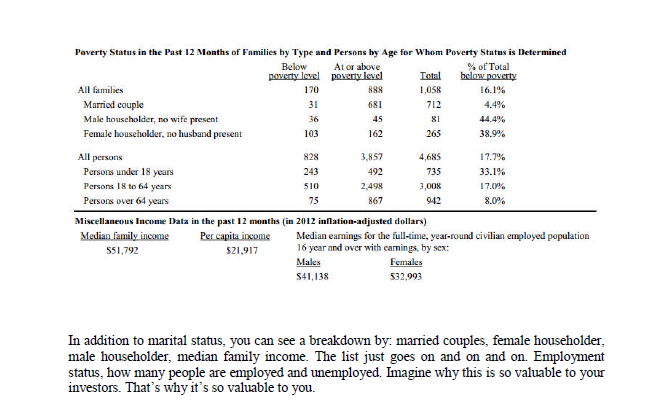
Not only can you see population by age has broken down, but you can also find the place of birth,
marital status, ancestry, disabilities.
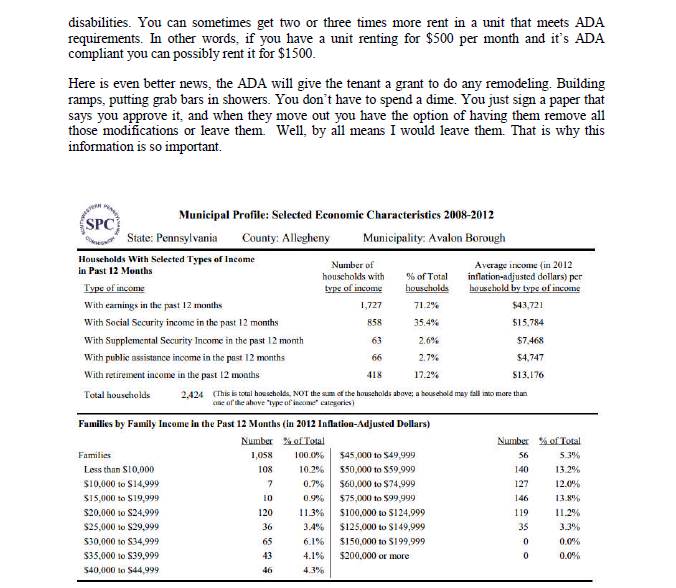
You can also find salary information. Average income with earnings for the past twelve months.
Social Security income, supplemental income, public assistance. When you see a neighborhood
where very few people get public assistance, you can conclude that it is probably a very desirable
the area to invest in.
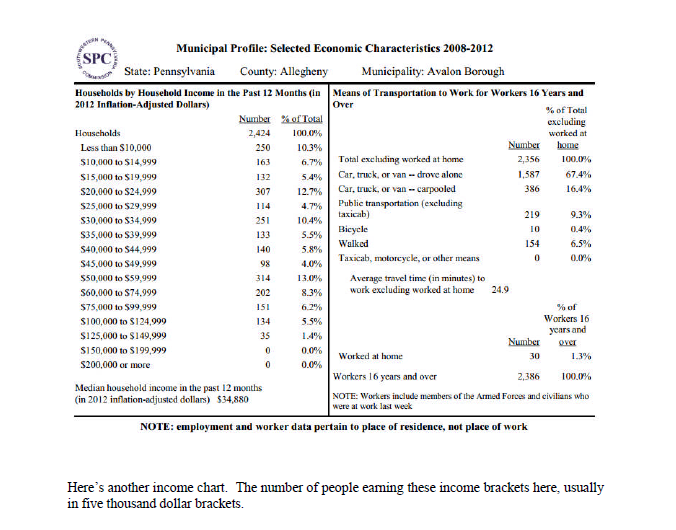
When you find a population with a salary range between $60-100k, that is a very good deal for
people looking to buy rental properties in the township. People on average make a lot of money
in this township.
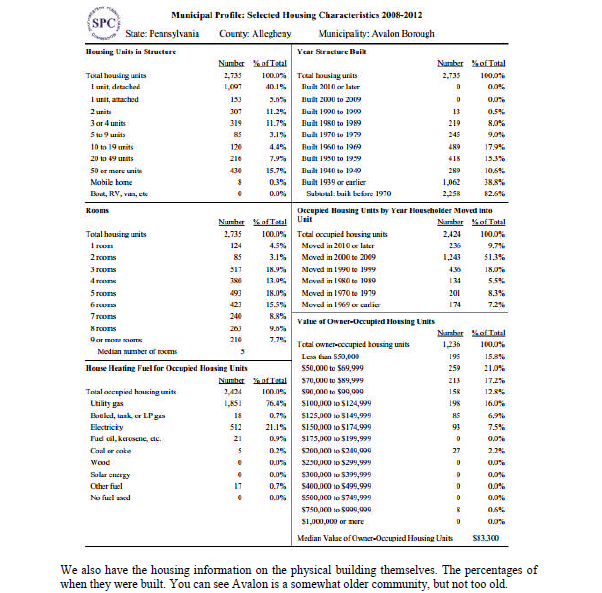
The bulk of the properties, actually half of them were built before 1939, which is important
because in the 1940’s World War II era, cinder block construction began. Builders started putting
in BX wiring – which is a ground wiring system. Prior to that, they had a lot of sandstone
foundations.
You can see a decent number of homes were built in the 1940s, 1950s and 1960s. A lot of rental
properties do tend to be older. It doesn’t mean they are bad properties, they are just older. A lot
have been remodeled, most in fact.
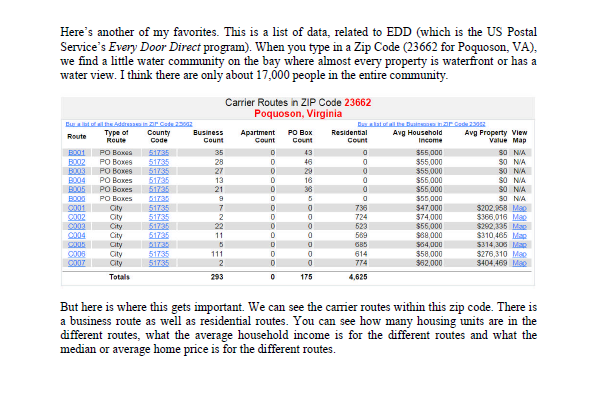 If you are flipping properties, where would you want to be in this map? You might want to be in
the range where people make $62k annually and the average home is worth $400k. Or on the
route where people make $64k and the average home value is $314k.
You may not want to be flipping in the route where people average $47k with $202k home
values. You still could, but if you are flipping anyway, why not target areas with more income
and more value in the homes?
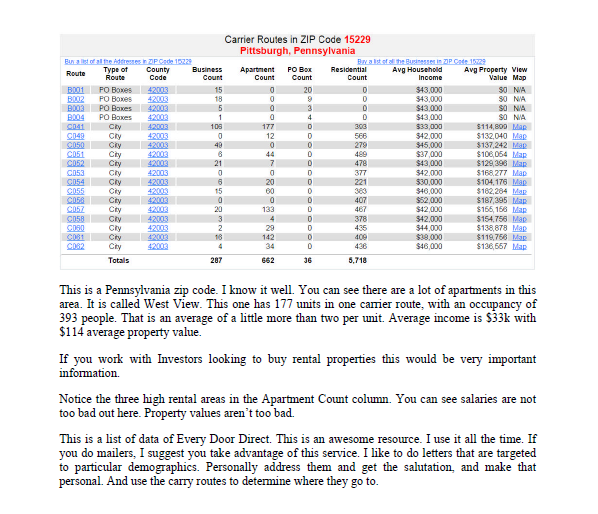
In Module Four, we’ll talk about doing what’s called “direct mailing” to attract business. It
works like a charm. We’ve sent mailers out to certain zip codes, or certain carrier routes by zip
codes, and gotten as high as a 50% return call rate. That is just unheard of in our business. Most of the time it’s 2-3%.
However, I’ve never gotten a return call rate less than 10%, because I highly target who’s going
to get my letters. They’re very niche-specific, and that’s how you can create such a high open
rate and return call rate.
How I Did 110 Transactions A Year With NO Assistants…And You Can Too… Get My Case Study Now>> https://www.myinvestmentservices.com/gift
“Guiding You to Massive New Wealth in Real Estate in 1 Year or Less Guaranteed!”
0 Comments